
3 The Tests of Concomitant Variation
There are four basic ways that concomitant variation may need to be tested. These depend on the type of variable of each the Independent and Dependent variables. Note that with the one exception noted below, Ordinal variables are treated similarly to Categorical variables.
Relationship Testing
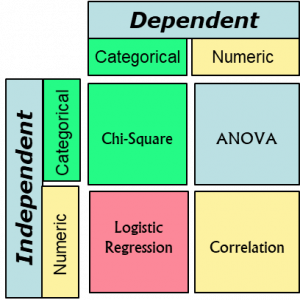
1) When both the Independent and Dependent variables are Categorical, the statistical test is called Chi-square (χ2). Examples would be trying to establish if there is a (concomitant) relationship between geographic region and cola preference or between undergraduate major and automobile make/model.
2) When the Independent variable is Categorical and the Dependent variable is Numeric, the statistical test is called the Analysis of Variance (ANOVA).[1] Examples would be an attempt to understand if there was a relationship between favorite color and amount spent on an automobile or between undergraduate major and salary (5 years after graduation).
3) When the Independent variable is numeric and the Dependent variable is categorical, the statistical analysis is called Logistic Regression. Logistic Regression would be used, for example, in an attempt to identify a relationship between the number of years of formal education (Independent variable) and preferred social media platform (dependent variable) or between hours per week watching television and preferred news outlet. The three types of Logistic Regression are: Binary, Ordinal and Nominal.
4) And when both the Independent and Dependent variables are Numeric, the statistical procedure utilized is Correlation. This test would be conducted, for example, to test whether (or not) there exists a statistical relationship between total lifetime work-related airline trips and age of retirement or if the nightly number of guests at a hotel could be used to predict the number of patrons served at that hotel’s restaurant. (And, as a follow-up, a Regression procedure would be run to identify the nature of any linear relationship between the two.)
A quick note: There are two basic versions of Correlation that are used by researchers: 1) Pearson Correlation, where both variables are, indeed, numeric (as has been defined herein) and 2) Spearman (rank) correlation, where at least one of the variables is measured on an ‘Ordinal’ (e.g., ranked) scale.
- When there are only two categories for the Independent variable, the test used is ‘difference in means t-test.’ This test may also be conducted when there are more than two categories. In this situation, a series of such t-tests among all possible pairs of categories could be conducted and would result in essentially the same statistical conclusion as an ANOVA. ↵
