
5 Chapter 5- The Contribution Margin / Gross Profit-
The Contribution Margin / Gross Profit
Contribution Margin
The contribution margin (CM) is a financial metric that tells you how much money a food & beverage operation earns after covering its variable costs for producing food and beverage menu items. The leftover revenue contributes to paying for the company’s fixed costs and generating a profit.
Here is a breakdown:
- Variable costs: These are expenses that change with business volume (e.g., food cost, beverage cost, labor cost).
- Fixed costs: These are expenses that stay the same regardless of production volume (e.g., rent, salaries for administrative staff, and utilities).
The contribution margin shows how much each sales dollar can pay for fixed costs and contribute to the bottom line (profit). Companies use contribution margins to understand pricing strategies, cost structures, and profitability. See the contribution margin example below.
Gross Profit
Gross profit, sometimes called sales profit or gross income, is a financial metric that shows a company’s profit after deducting the costs associated with producing and selling its products or services—gross profit reflects a business’s initial profit before accounting for other operating expenses or taxes. You will calculate gross profit, operating expenses, and taxes in Chapter 8, Income Statements.
Here is a breakdown of how gross profit is calculated:
- Revenue: Total sales before any deductions.
- Cost of Goods Sold (COGS): These are the direct costs of producing menu items. (Food Cost/Beverage Cost)
Formula: Gross Profit = Revenue – Cost of Goods Sold (COGS)
- Gross profit is a stepping stone to Net Profit, which considers all the company’s expenses, including operating expenses, interest, and taxes. See the gross profit example below.
Food Cost vs. Contribution Margin
We will compare the food cost and the contribution margin of two menu items: a chicken dish and a shrimp dish.
Food Cost vs. Contribution Margin: Food Cost Example
- The Shrimp Dish has a:
-
- Selling price of $27.00
-
- Food cost of $12.00
-
- Food cost % of 44.4%
-
- $12/$27 = 44.4%
- The Chicken Dish has a:
-
- Selling price of $18.00
-
- Food cost of $6.00
-
- Food cost % of 33.3%
-
- $6/$18 = 33.3%
After comparing the shrimp to the chicken, the chicken dish seems like the one you want to sell more because it has a lower food cost percentage.
Food Cost vs. Contribution Margin: Gross Profit/Contribution Margin Examples
- The Shrimp Dish has a:
-
- Selling price of $27.00
-
- Food cost of $12.00
-
- Contribution margin of $15.00
-
- $27 – $12 = $15
- The Chicken Dish has a:
-
- Selling price of $18.00
-
- Food cost of $6.00
-
- Contribution margin of $12.00
-
- $18 – $6 = $12
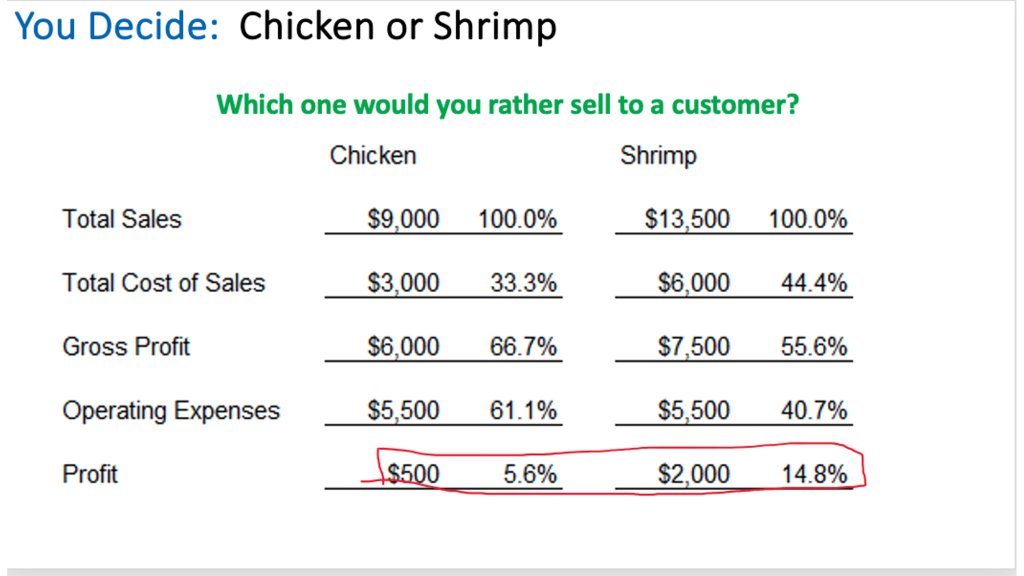
Assume we have a restaurant that only sells two dishes: shrimp and chicken. Suppose 500 customers come to the restaurant and order the same thing. We can also get more realistic and say we have a banquet of 500. The picture below will show you the profit from each party. Would you rather sell this customer the chicken or the shrimp? I would take $2,000 daily over $500 regardless of food cost percentage.
Suppose we could design a menu to lead the customer to buy the items that we make the most profit on. We could engineer a menu to do this in the next chapter; that is what we will do with menu engineering.
Media Attributions
- Cont Marg 1
