4 Chapter 4- Food and Beverage Inventory Management
Monthly Cost of Sale – Inventory
Conducting Monthly Inventory: Inventory within the food & beverage industry is typically done in one of two ways.
A physical count involves physically counting all your food and beverage items on a designated monthly date(s). Monthly Inventory should account for all food & beverage items, including items in storage, raw ingredients, pre-prepared items, and finished goods. It is best to use two people. One calls out the item’s name, the package size or weight, and how many items there are. The other person helping repeats what the first person called out, finds it on the chart, spreadsheet, or inventory software, and records how many items (or weight) are in stock. The inventory category values are totaled and extended, and all category values are totaled to get the dollar value of all the food and beverage inventories.
A perpetual inventory system is a continuous tracking method for monitoring stock levels through an electronic inventory system or software application. Unlike periodic systems that rely on physical counts at specific intervals, perpetual systems update inventory data in real time whenever an item is purchased, issued, used, or wasted. However, even perpetual inventory is counted using the physical inventory method at least once a year to ensure data accuracy in the inventory system or software application.
Monthly Cost of Sales – Inventory Value
After completing an inventory of all food and beverage items, ending inventory values need to be calculated, as in the example below.
 Here, we see that the total food inventory for the inventory period is $13,258.06.
We would use this end-of-the-month food inventory value to calculate monthly food costs. (We will expand on this concept in Chapter 7 and differentiate between the cost of goods consumed and the cost of goods sold). The ending inventory dollar amount (value) is also the beginning inventory amount for the new month. For example, June’s end-of-the-month food inventory is $13,258.06, and July’s beginning inventory is $13,258.06.
Monthly Cost of Sales (Basic Formula)

Food Inventory Example

We could then determine food costs by using food sales for the month. If sales were $98,000 for the month and our cost of food sold was $32.100, the food cost for the month would be 32.8%. ( $32,100 / $98,000 = 32.8%)
Monthly Inventory Valuation Methods
Before determining the cost of sales, one needs to know the dollar value of the products in inventory. There are several different methods, so choosing the proper method is essential. The best method for your food and beverage business depends on several factors, including the type of inventory, the perishability, and the cost variability of your ingredients in the inventory management system. Perpetual inventory systems can facilitate methods like First In, First Out (FIFO). While manual systems might be better suited for average cost and tax implications, speaking to an accountant to determine the most suitable inventory valuation method for your food and beverage business is best. Continue reading to learn about the five inventory valuation methods.
Important Note: the following five inventory valuation methods are to provide you with an inventory dollar amount and should not be confused with inventory rotation methods.
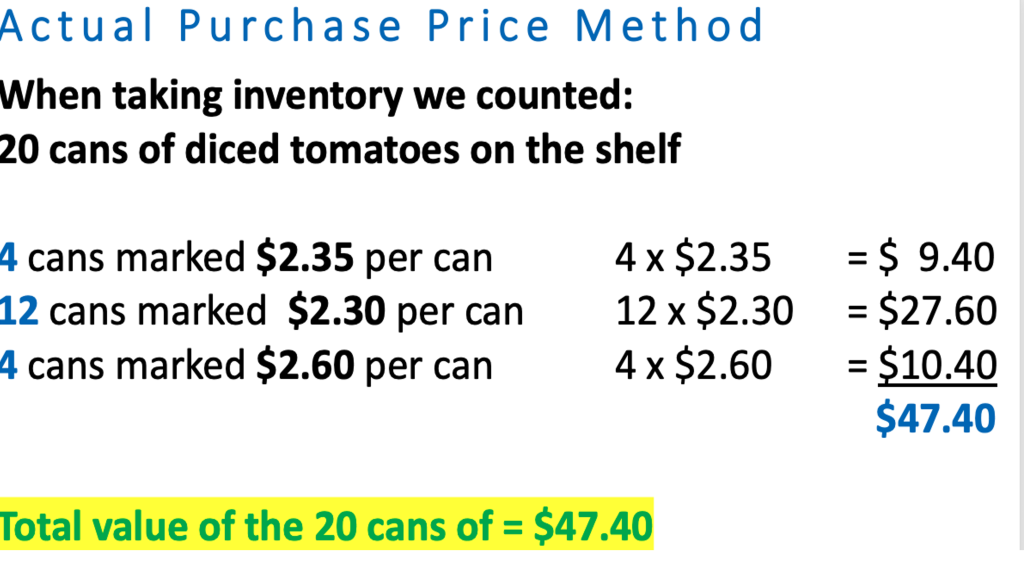
The actual purchase price method involves marking the item’s price on the package as it arrives. This method is awkward and time-consuming and cannot be used for everything in the inventory, but it can be used for high-cost items such as lobster meat or steaks.
Here is how this Actual Purchase Price Method works: Our storeroom has 20 cans of diced tomatoes on the shelf, all marked with the actual purchase price as they were placed on the shelf. Four are marked to show a cost of $2.35, 12 are marked to show a cost of $2.30, and four are marked to show a cost of $2.60. By adding up the values written on the 20 cans, we find that the value of the twenty cans is $47.40.
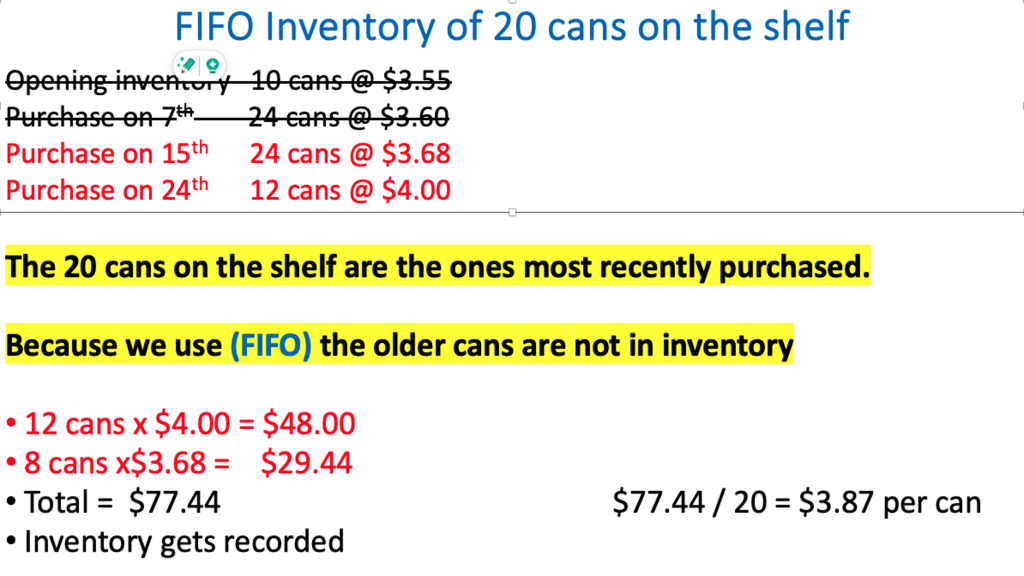
The FIFO (First In, First Out) method considers the cans that came in first, the ones from the opening Inventory, and those purchased earlier in the month that are no longer on the shelf. By properly rotating the stock, only the most recent purchases cans are on the shelf. Our storeroom has twenty cans of diced tomatoes on the shelf, and 12 of them are purchased on the 24th of the month. The remaining eight were purchased on the 15th of the month. We recorded $47.40 as the value of the 20 cans.
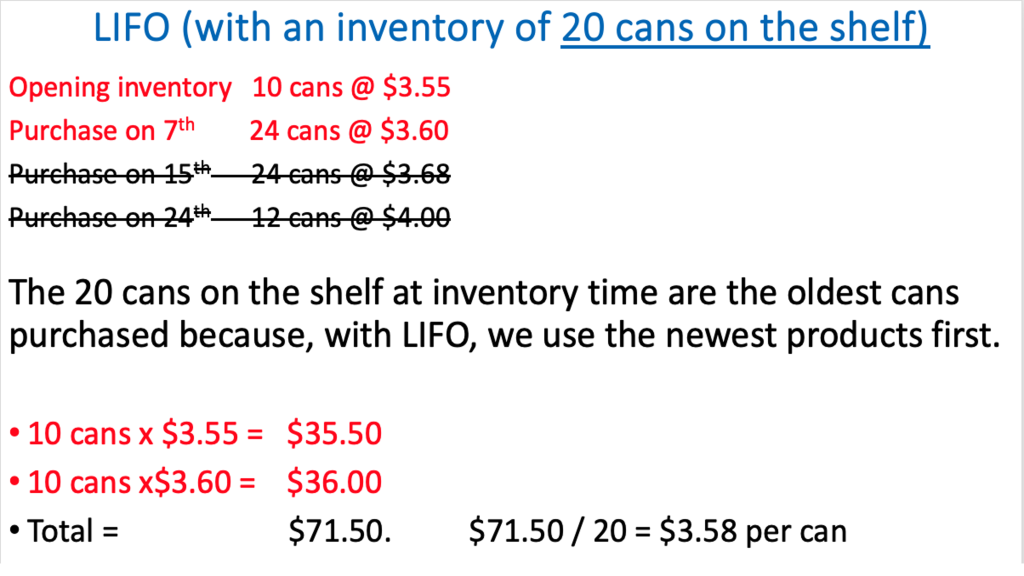
The LIFO Method (Last in, First Out Method) is the opposite of the FIFO (first in, first out) method. Although this method is not often used in the Food & Beverage industry because of product quality concerns and perishability, for some businesses, it could work. Remember, our inventory indicated 20 cans of diced tomatoes on the shelf. By using LIFO as our method of product rotation, we have ten cans from our opening inventory at $3.35 and 10 cans purchased on the 7th at $3.60. We recorded $71.50 as the value of the 20 cans.
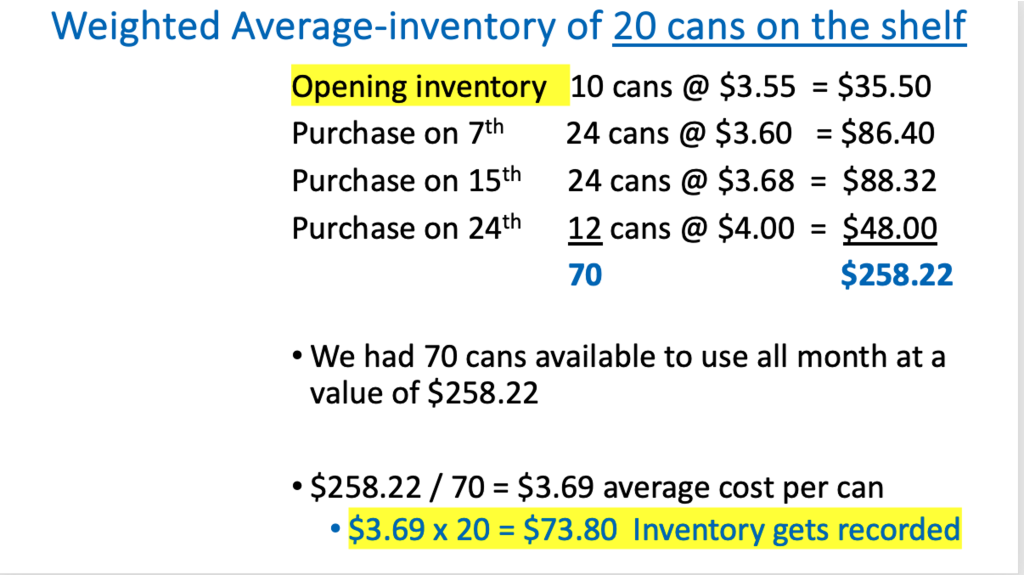
The Weighted Average Method assumes that all the cans in inventory are the same price regardless of when they were purchased and at what cost, simplifying inventory. To use this method, we use the opening inventory plus all purchases of canned tomatoes made during the month, including prices, to determine the inventory value for the 20 diced tomatoes remaining on the shelf. We recorded $73.80 as the value of the 20 cans. There are some advantages and disadvantages to using this method; some advantages include simpler recordkeeping, more accurate COGS during dramatic price fluctuations, and simplicity. Some disadvantages of this method include that it does not necessarily show if the food & beverage operation is using older or newer inventory first. If there are drastic price changes, the average cost might not accurately represent the cost of ingredients used.
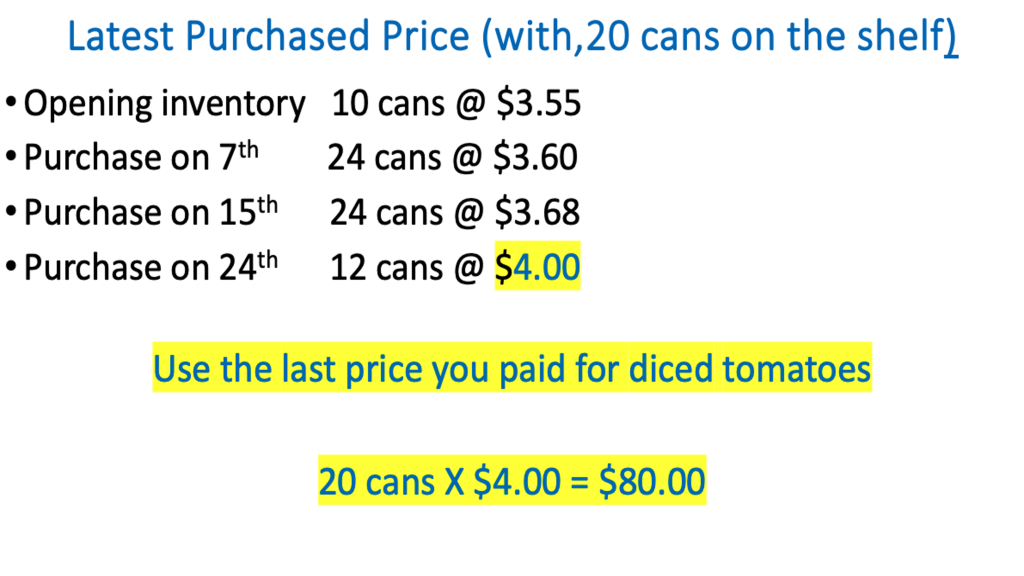
The Latest Purchase Price Method is frequently used in the food and beverage industry due to its convenience. Using the last purchase price for the diced tomatoes, determine the value of each of the 20 cans in inventory.
Cost of Good Sold (COGS)
Monthly Inventory is crucial for calculating the Cost of Goods Sold (COGS) in the food and beverage industry. COGS calculations rely on accurate inventory data. Tracking COGS helps you monitor inventory usage and identify areas for improvement. Knowing this cost lets you calculate your gross profit by subtracting COGS from your total sales revenue. Some additional considerations, while not directly reflected in inventory counts, include spoilage, theft, and other forms of waste that directly impact the COGS.
By monitoring COGS trends over time, you can identify potential cost increases and take corrective actions such as negotiating better deals with suppliers, finding more cost-effective ingredients, or implementing waste reduction strategies. In short, COGS is a fundamental tool for food and beverage businesses to assess their financial health, make data-driven decisions, and achieve long-term success. It provides insights into the cost of producing your offerings, allowing you to optimize pricing, manage inventory effectively, and maximize your profit potential. By taking monthly inventory and calculating COGS effectively, food and beverage operations gain valuable insight into their financial performance, allowing them to make data-driven decisions.
Calculating Cost of Goods Sold (COGS)
COGS = Beginning Inventory + Purchases – Ending Inventory
- Beginning Inventory: The value of your food and beverage at the start of the month.
- Purchases: The total cost of all food and beverage items purchased during the month (including freight and taxes).
- Ending Inventory: The value of your remaining food and beverage stock at the end of the month.
Example:
- Beginning Inventory (March 1): $5,000
- Purchases (March): $8,000
- Ending Inventory (March 31): $3,000
COGS (March): $5,000 (Beginning Inventory) + $8,000 (Purchases) – $3,000 (Ending Inventory) = $10,000
Calculating the Inventory Turnover Rate
The Inventory Turnover Rate – How Fast Are Your Food & Beverage Products Moving?
Average inventory is the average value of your inventory over a period of time, typically a month. A higher turnover rate indicates that your stock is selling quickly, which is reasonable. However, a high rate might also mean you are frequently out of stock. A low turnover rate may mean you have too much inventory, which can have financial impacts, such as perishable products going bad or less cash.
Inventory Ratios: Inventory ratios are a set of financial metrics used to assess how efficiently a food and beverage operation manages its inventory. These ratios help identify potential problems with inventory levels, such as having too much or too little stock on hand. By analyzing these ratios, food and beverage operations can make data-driven decisions about purchasing, pricing, and overall inventory management strategies.
The Inventory Turnover Ratio is the most common industry measurement and shows how often a company sells and replaces inventory over a specific period. A higher ratio indicates strong sales and efficient inventory management, while a low ratio suggests potential issues like overstocking or poor sales.
To calculate the Inventory Turnover Ratio, you must complete the following two steps:
- Determine the Average Inventory Value
- Use the Cost of Food Consumed divided by the Average Inventory Value
Example
- Step 1: Calculate the Average Inventory: To calculate the average inventory value, you take the beginning inventory, add that value to the ending inventory, and divide it into two.
- Beginning Inventory = $3,500
- Ending Inventory = $2,850
- The calculation would be
- $3,500 + $2,850 = $6,35
- $6,350 / 2 = $3,175
- The calculation would be
- Average Inventory = $3,17
- Step 2: Take the Cost of Food Consumed divided by the Average Inventory Value:
- If the Cost of Food Consumed = $22,650\
- The Average Inventory Value = $3,175
- The calculation would be
- $22,650 / $3,175 = 7.13
- Inventory Turnover Rate= 7.13
Determine How Many Days the Product is in Inventory
How Many Days Has the Product Been in Inventory
Now that we have determined the inventory turnover rate, we can calculate the number of days the product has been in inventory. To do this, we use the inventory turnover rate and the number of days in the month.
Example
- There are 30 days in the month
- The inventory turnover rate is 7.13
- 30 / 7.13 = 4.21
- The product has been sitting in inventory for 21 days
If you use this calculation for your entire food inventory, remember that fresh products turnover more quickly, whereas dry goods turnover more slowly. Turnover rates in beverages tend to be lower as they may sit for months or even years before being sold. But the house wine and beers might turnover quickly. Interpreting inventory ratios often requires industry benchmarks for comparison. A high inventory turnover ratio in one food & beverage operation might be undesirable in another.
Just in Time Inventory (JIT)
Just-in-Time (JIT) Inventory: A Lean Approach
Just-in-Time (JIT) inventory is a lean management strategy focused on minimizing inventory levels and waste within a food and beverage operation. By aligning purchases with production and sales demands, food & beverage operations can optimize their cash flow and reduce costs.
Critical Characteristics of JIT Inventory:
- Minimal Inventory: Maintaining the lowest possible inventory levels of ingredients, supplies, and finished products is crucial in JIT. This reduces storage costs and minimizes spoilage and cash tied up in excess inventory.
- Frequent Deliveries: Establishing regular, smaller supplier deliveries helps ensure a consistent product flow without overstocking. This requires strong communication and collaboration with suppliers.
- Strong Supplier Relationships: Building trust and reliability with suppliers is essential for JIT’s success. Close partnerships enable timely deliveries, consistent product quality, and the ability to address issues promptly.
- Continuous Improvement: JIT is a dynamic process that requires ongoing monitoring and adjustment. Regularly reviewing inventory levels, supplier performance, and production schedules helps identify areas for improvement and optimize the system.
Benefits and Challenges:
Implementing JIT can lead to significant cost reductions, improved product quality, increased efficiency, and enhanced responsiveness to customer demand. However, it also presents challenges such as the need for accurate demand forecasting, potential stockouts during supply chain disruptions, and increased reliance on supplier performance.
Technology’s Role in JIT Inventory Management
Technology is a powerful ally in implementing and optimizing JIT inventory management within the food and beverage industry. By leveraging digital tools, food & beverage operations can enhance accuracy, efficiency, and decision-making.
Key Technological Tools:
- Point of Sale (POS) Systems: Real-time sales data from POS systems provides invaluable insights into product demand, enabling businesses to adjust inventory levels accordingly.
- Inventory Management Software: Specialized software tracks inventory levels, monitors stock movement, and generates alerts for low stock or potential shortages.
- Barcode and RFID Technology: These systems enable rapid and accurate inventory tracking, reducing the time and errors associated with manual counting.
- Demand Forecasting Software: Advanced analytics and machine learning algorithms can predict future demand patterns, helping to refine purchase orders and prevent stockouts.
- Supply Chain Management (SCM) Software: Integrating with suppliers through SCM software facilitates better communication, order placement, and delivery schedules, supporting JIT principles.
- Warehouse Management Systems (WMS): For more extensive operations, WMS optimizes storage, picking, and packing processes, contributing to overall inventory efficiency.
How Technology Supports JIT:
Technology such as artificial intelligence provides up-to-date information on inventory levels, enabling timely adjustments to purchase orders. Automated data collection with suppliers through technology streamlines communication and collaboration, reduces human error and ensures accurate inventory records.
Data-driven insights support informed decisions about product ordering, production planning, and resource allocation and reduce carrying costs and waste by minimizing stockouts and excess inventory.
By harnessing the power of technology, food and beverage businesses can effectively implement JIT inventory management, leading to improved profitability, customer satisfaction, and operational efficiency.
Media Attributions
- Screenshot 2024-09-14 at 4.16.33 PM
- Screenshot 2024-09-14 at 4.30.36 PM
- Screenshot 2024-09-14 at 4.32.38 PM
- Inventory method 1
- Inventory 2
- Inventory 3
- Inventory 4
- Inventory 5

